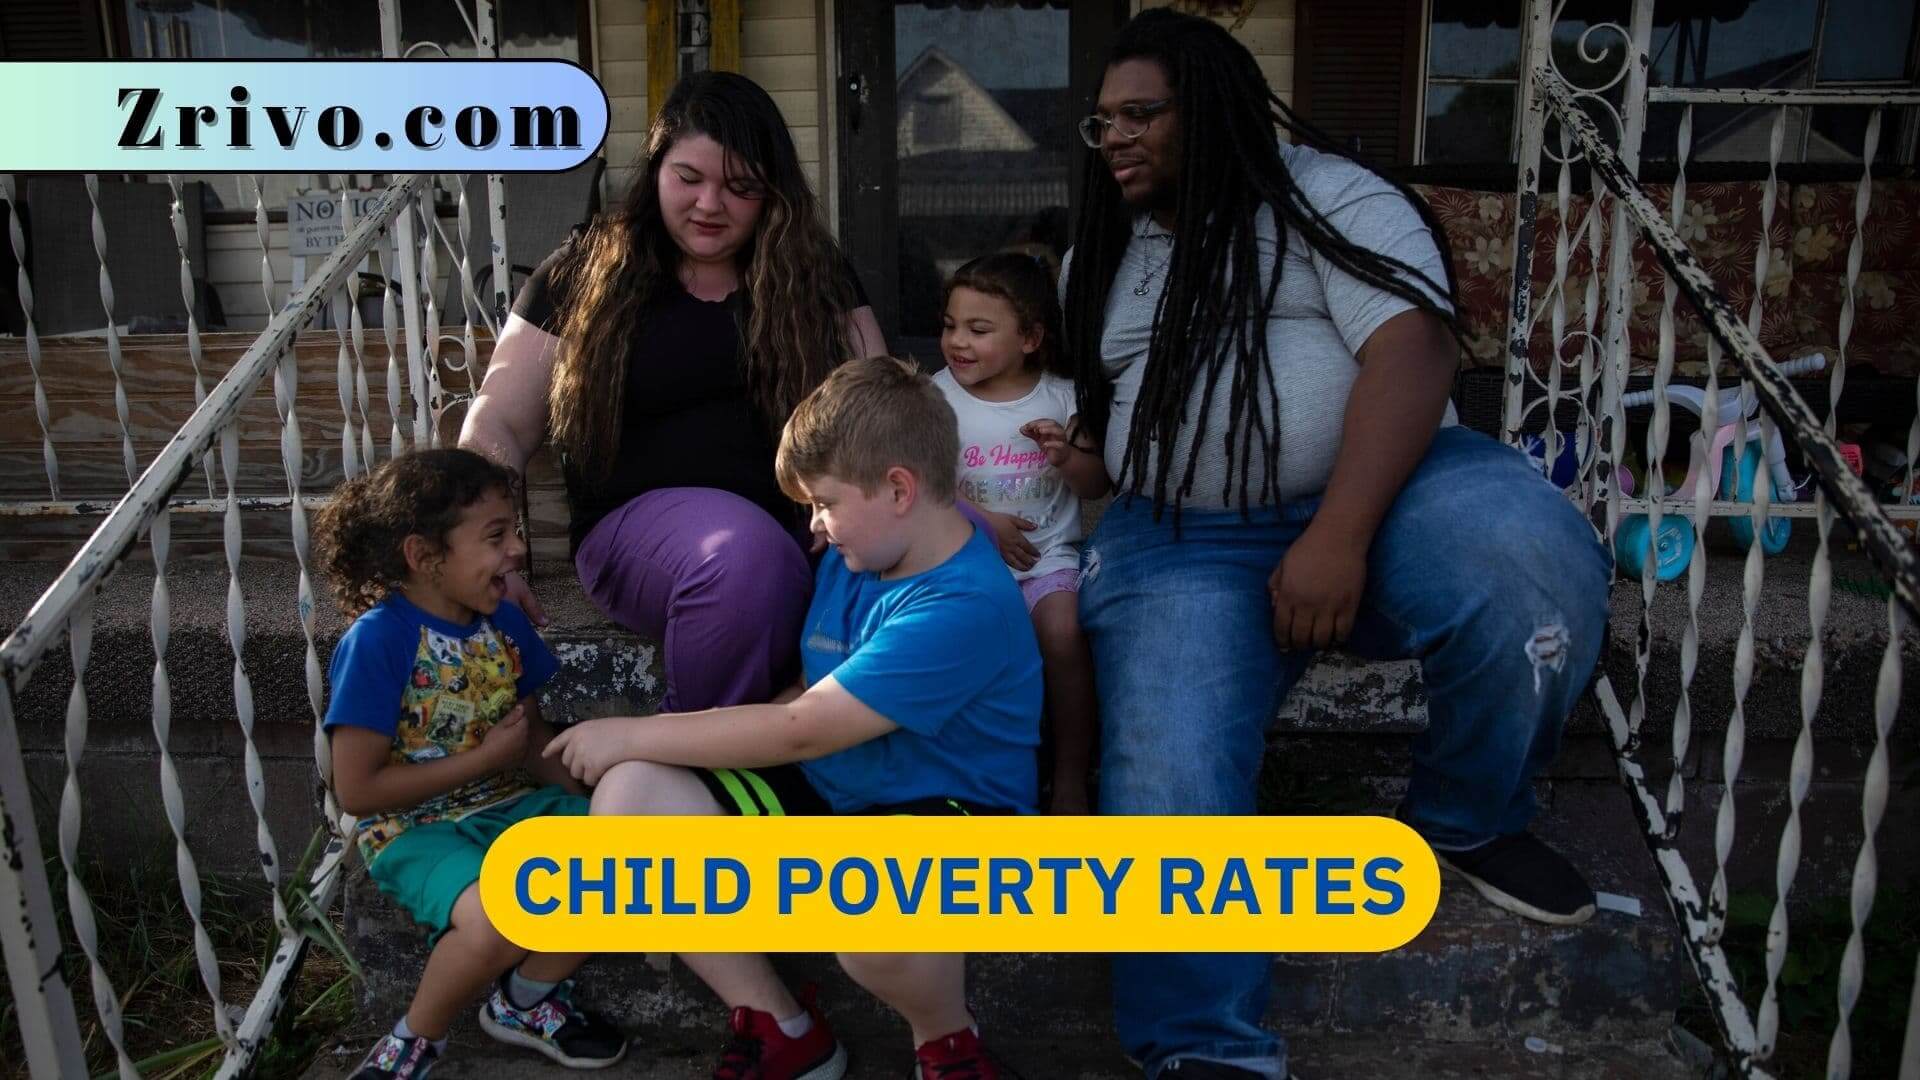
Although the number of children living in families considered officially poor (earning less than 50% of the federal poverty threshold) reached new lows (2021), they still represent one in six American kids. These numbers reflect the persistent roadblocks that continue to block economic mobility for many American children. Child poverty rates vary significantly in the United States by race, ethnicity, and family structure. For example, Black and Hispanic children are more likely to live in impoverished households than white and Asian children. Poverty rates also differ by state, with the lowest levels in New Hampshire and the highest in Mississippi.
While the official poverty rate declined during the COVID-19 pandemic, the supplemental measure of poverty (before considering government benefits) increased slightly. This reflects the fact that most of the economic growth in recent decades has benefited families on the top rungs of the income ladder. Poverty remains an enormous challenge for millions of children in the United States, but progress towards eliminating child poverty is vital for advancing children’s long-term prospects. Research shows that children growing up in poverty are more likely to fall behind academically, perform worse on standardized tests, and have health problems as adults. Additional gains in poverty reduction can help break these inequality cycles and improve all Americans’ lives.

Child Poverty Rates by State 2024
While child poverty rates have dropped overall since the recession, large racial/ethnic disparities remain and have actually widened. Fortunately, we know what works to reduce these gaps. In particular, investing in education has proven to be a powerful tool for children from low-income families to break the cycle of poverty and increase opportunities for upward mobility.
In addition to improving children’s educational outcomes, the right mix of policies can help increase jobs, lower income inequality, and reduce child poverty. The first report in our new series, titled “Children, Families and Poverty”, looks at how these policies work together to make a difference for children.
This brief highlights the importance of the expansion of refundable tax credits to reduce poverty among working families. It also shows how a monthly benefit delivery approach can effectively smooth within-year volatility in household incomes and reduce child poverty year-round.
| Mississippi | 27.57% | 191,339 | 693,906 |
|---|---|---|---|
| Louisiana | 26.34% | 284,760 | 1,081,097 |
| New Mexico | 25.56% | 121,373 | 474,884 |
| West Virginia | 23.13% | 82,218 | 355,520 |
| District of Columbia | 22.83% | 28,347 | 124,153 |
| Alabama | 22.74% | 244,726 | 1,076,150 |
| Kentucky | 22.16% | 218,023 | 983,940 |
| Arkansas | 22% | 151,653 | 689,387 |
| South Carolina | 21.2% | 231,061 | 1,089,946 |
| Tennessee | 20.83% | 308,226 | 1,479,850 |
| Oklahoma | 20.73% | 194,537 | 938,307 |
| Georgia | 20.09% | 495,477 | 2,466,599 |
| Texas | 20.05% | 1,462,277 | 7,293,273 |
| North Carolina | 20.01% | 452,423 | 2,261,173 |
| Arizona | 20% | 321,919 | 1,609,860 |
| Ohio | 19.13% | 486,835 | 2,545,054 |
| Michigan | 18.77% | 398,119 | 2,121,489 |
| New York | 18.68% | 746,203 | 3,994,613 |
| Florida | 18.67% | 773,801 | 4,145,349 |
| Nevada | 17.62% | 119,005 | 675,571 |
| Indiana | 17.56% | 269,559 | 1,535,005 |
| Missouri | 17.35% | 233,927 | 1,347,911 |
| Delaware | 17.21% | 34,390 | 199,880 |
| California | 16.8% | 1,480,649 | 8,815,673 |
| Pennsylvania | 16.7% | 434,413 | 2,600,657 |
| Illinois | 16.16% | 454,654 | 2,813,715 |
| South Dakota | 16.06% | 33,852 | 210,809 |
| Rhode Island | 15.65% | 31,629 | 202,159 |
| Montana | 15.16% | 33,815 | 223,110 |
| Oregon | 15.02% | 127,349 | 847,858 |
| Idaho | 14.37% | 63,003 | 438,474 |
| Wisconsin | 14.16% | 177,140 | 1,250,830 |
| Maine | 13.99% | 34,067 | 243,504 |
| Kansas | 13.94% | 96,696 | 693,728 |
| Alaska | 13.84% | 24,864 | 179,636 |
| New Jersey | 13.34% | 257,552 | 1,930,346 |
| Iowa | 13.31% | 95,105 | 714,639 |
| Virginia | 13.14% | 241,637 | 1,838,531 |
| Connecticut | 13.03% | 94,665 | 726,564 |
| Washington | 12.56% | 204,059 | 1,625,130 |
| Vermont | 12.32% | 13,975 | 113,470 |
| Wyoming | 12.27% | 16,175 | 131,843 |
| Massachusetts | 12.24% | 164,081 | 1,340,628 |
| Nebraska | 12.21% | 56,828 | 465,570 |
| Hawaii | 11.7% | 34,575 | 295,576 |
| Maryland | 11.62% | 153,356 | 1,319,572 |
| Minnesota | 11.6% | 147,958 | 1,275,790 |
| Colorado | 11.55% | 143,390 | 1,241,717 |
| North Dakota | 11.12% | 19,459 | 175,040 |
| Utah | 9.94% | 91,046 | 915,887 |
| New Hampshire | 8.92% | 22,509 | 252,401 |
| United States | 12,598,699 | 72,065, |